
Keyword
Earth Science | Oceans | Salinity/Density | Salinity
1878 record(s)
Type of resources
Topics
Keywords
Contact for the resource
Provided by
Formats
Update frequencies
Status
draft
-
This dataset contains data collected by the Australian Continuous Plankton Recorder (AusCPR) survey and is funded by IMOS (Ships of Opportunity sub-facility) and CSIRO. The aims of the AusCPR survey are to: * map plankton biodiversity and distribution * develop the first long-term plankton baseline for Australian waters * document plankton changes in response to climate change * provide indices for fisheries management * detect harmful algal blooms * validate satellite remote sensing * initialise and test ecosystem models. The survey conducts repeat tows in the GBR, the East Australian Current and down to the Southern Ocean Time Series Mooring (SOTS). Other routes are conducted on an adhoc nature around Australia. The dataset also contains phytoplankton data from the UTAS / AAD led Southern Ocean CPR (SOCPR) project which is also funded by IMOS. The datasets available in this collection include Phytoplankton Colour Index (an estimate of chlorophyll in the water), phytoplankton abundance, zooplankton abundance and a biomass index from AusCPR and phytoplankton abundance from SOCPR. This data are freely available through the AODN portal: https://portal.aodn.org.au. This data is freely available but please acknowledge all relevant parties, as detailed in acknowledgement section.
-
This dataset comprises the phytoplankton abundance and biovolume estimates as part of a broader sampling program carried out at the Southern Ocean Time Series, a facility within the Integrated Marine Observing System (IMOS). The primary focus is sustained observing of ocean properties and processes important to climate, carbon cycling, and ocean productivity. Regular phytoplankton samples are collected at approximately 14 day intervals (exact intervals and seasonal coverage dependent on deployment length). The moorings are serviced annually, at which time the existing moorings are recovered and new moorings are deployed. Water samples from within the surface mixed-layer are collected at pre-programmed intervals using a Remote Access Sampler, in pairs about 1 hour apart. One sample in each pair is preserved for phytoplankton community composition by microscopy, and the other sample is preserved and used for accompanying chemical analysis of nutrients, total dissolved inorganic carbon (DIC) and alkalinity. Each sample is collected from within the surface mixed-layer at 32 m depth (2010 - 2017) or 5 m depth (2018-current) depending on the design of the mooring surface assembly and instrumentation. Typically a maximum of 24 samples are collected over an annual deployment cycle. The samples collected are analysed for: 1. Community composition / abundance (cells/L) 2. calculated biovolume (um3/L). Protocols for the phytoplankton time-series are described in Eriksen et al (2018), and the annual sample reports for each deployment. Data storage and access is planned to be interoperable with other national and international programs through the IMOS Infrastructure. Station metadata can be found through this resource. Data is available freely via the AODN portal: https://portal.aodn.org.au. As the taxonomic resolution of the data has changed over time, due to continual training, it is important that users refer to the change log tables included in your data download. These will provide information on the validity of the taxa, from what date we have been identifying certain taxa etc. Classification fields may be blank depending on the level to which that taxa has been identified, i.e. if only identified to family, genus and species will be blank.
-
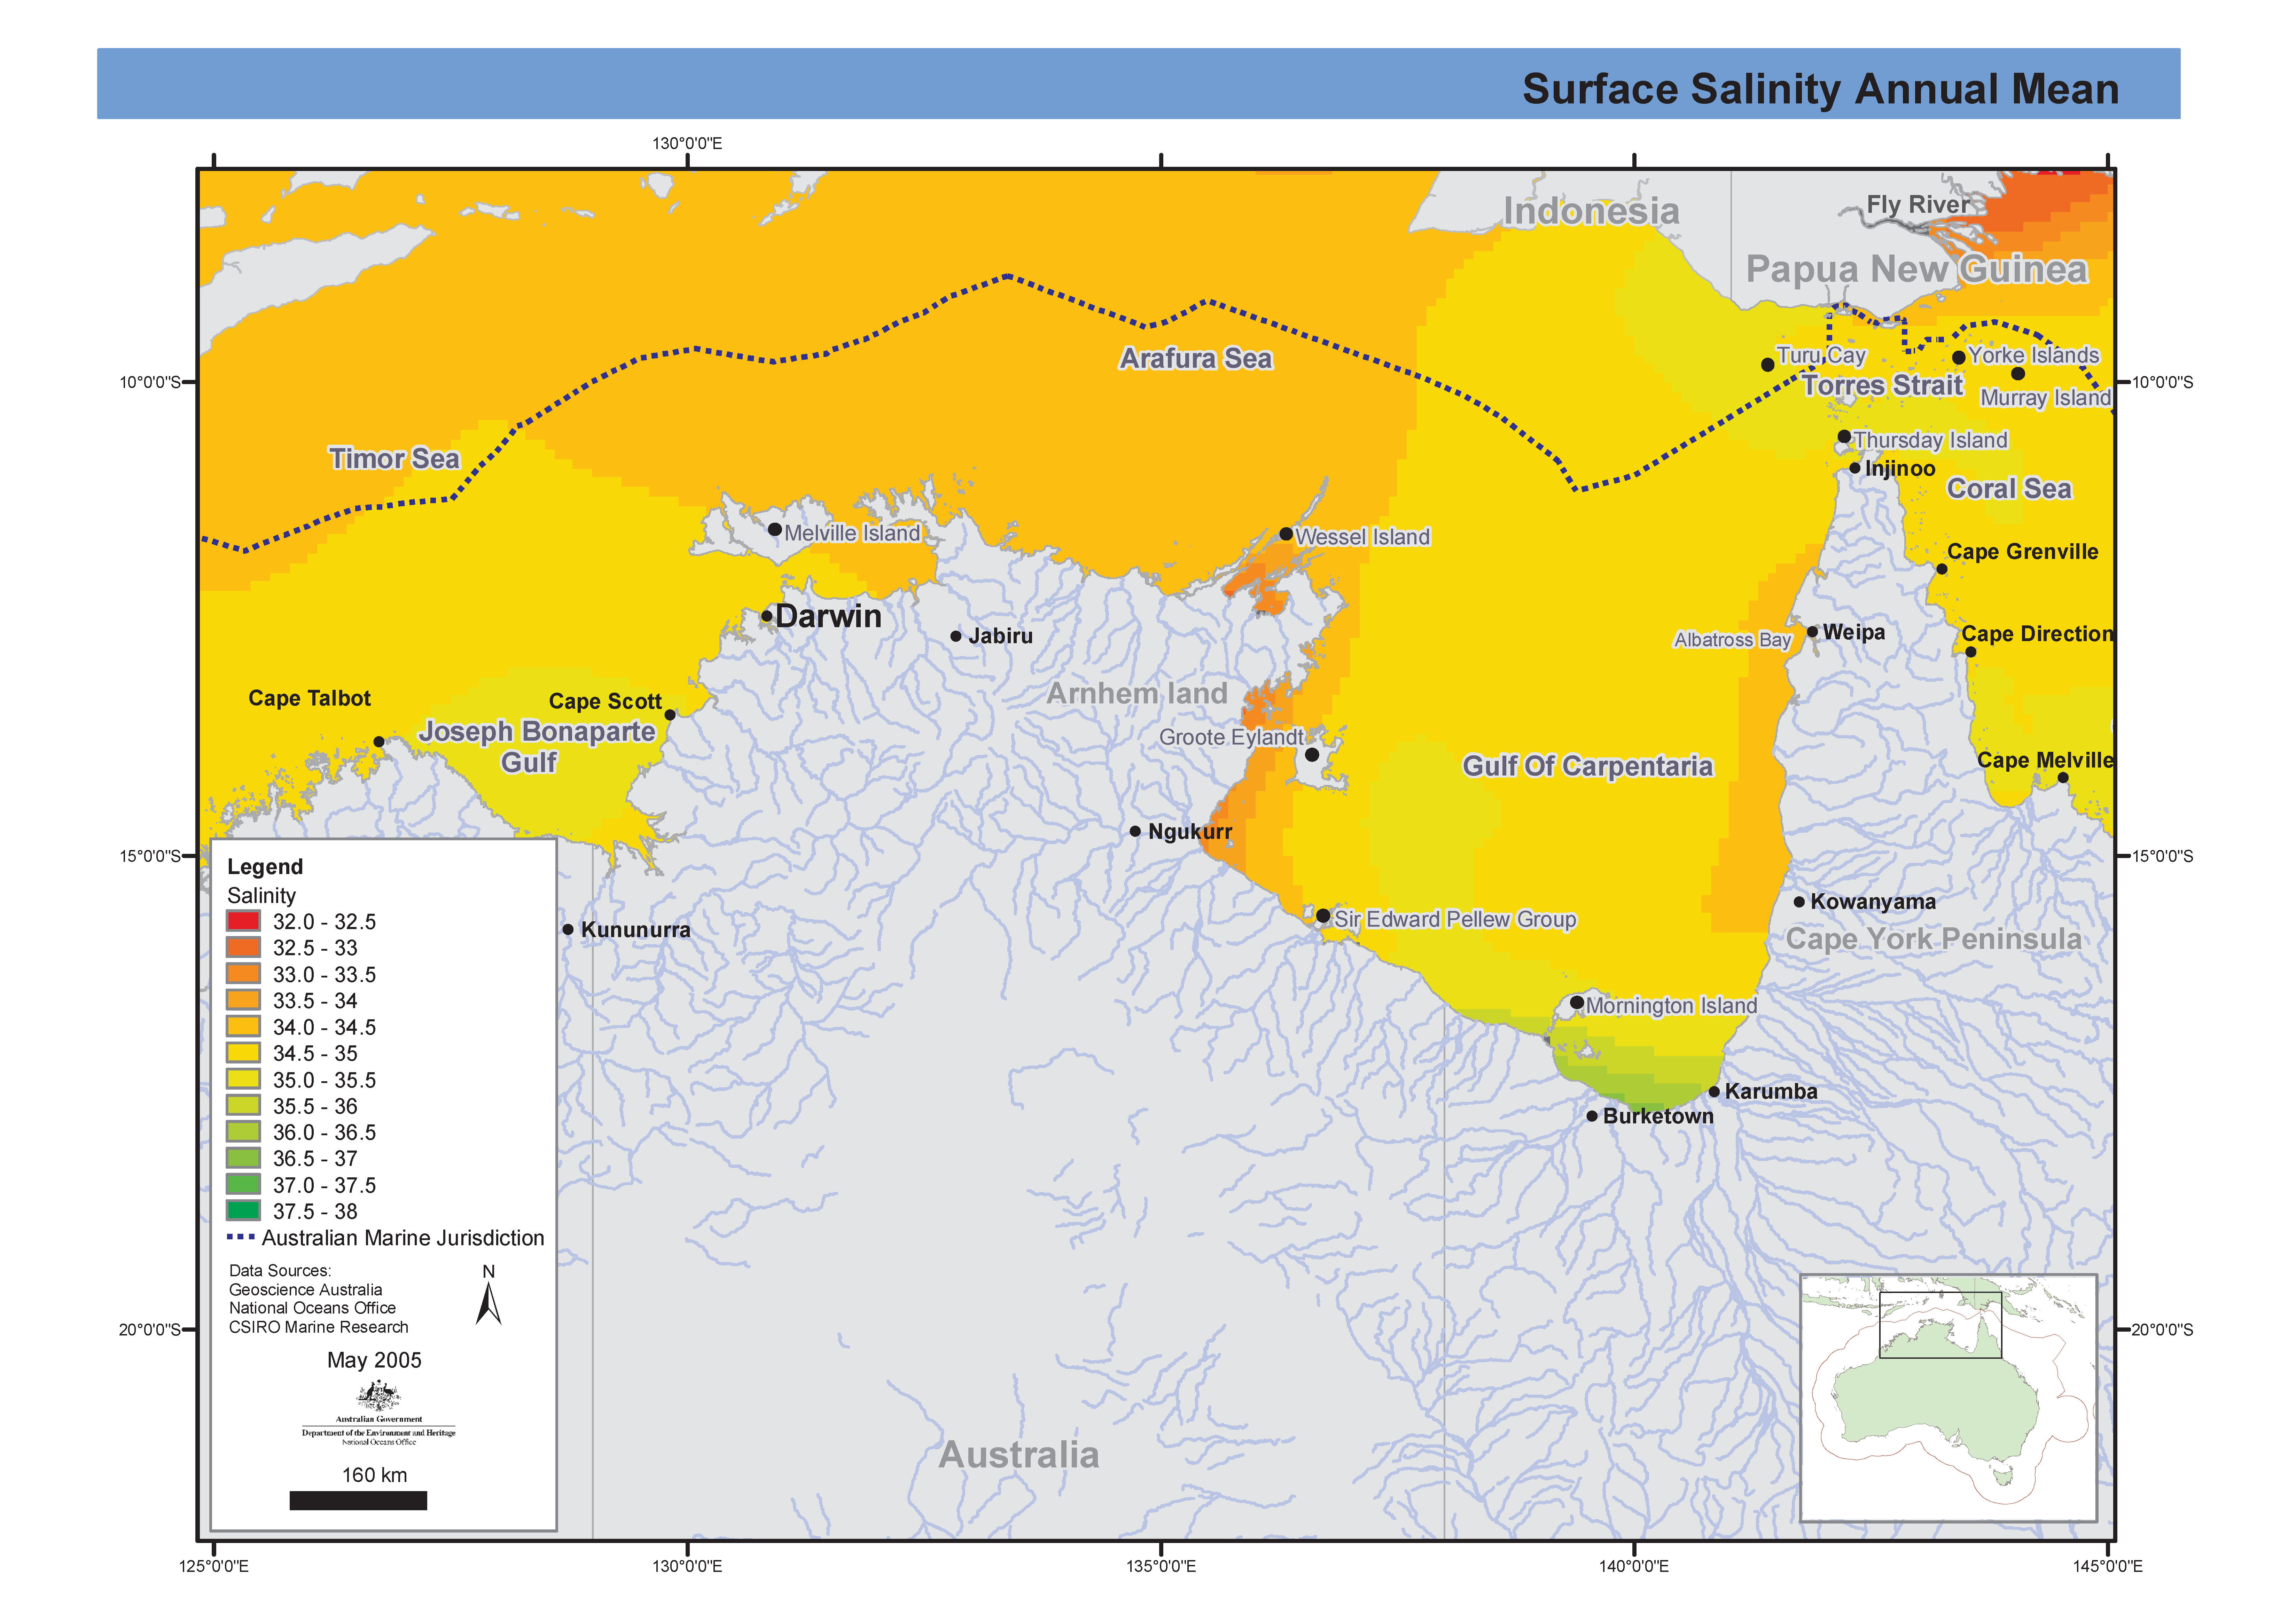
Map of annual mean of salinity in Northern Marine Region produced from CARS2000 mean and seasonal fields 0.1 degree spaced grid. This map has been produced by CSIRO for the National Oceans Office, as part of an ongoing commitment to natural resource planning and management through the 'National Marine Bioregionalisation' project.
-
ESRI grids showing sea salinity, linearly interpolated from CARS2000 mean and seasonal fields to 0.1 degree spaced grid, at depths of 0, 150, 500, 1000 and 2000 metres. The loess filter used to create CARS2000 resolves at each point a mean value and a sinusoid with 1 year period (and in some cases a 6 month period sinusoid - the "semi-annual cycle".) The provided "annual amplitude" is simply the magnitude of that annual sinusoid. CARS is a set of seasonal maps of temperature, salinity, dissolved oxygen, nitrate, phosphate and silicate, generated using Loess mapping from all available oceanographic data in the region. It covers the region 100-200E, 50-0S, on a 0.5 degree grid, and on 56 standard depth levels. Higher resolution versions are also available for the Australian continental shelf. The data was obtained from the World Ocean Atlas 98 and CSIRO Marine and NIWA archives. It was designed to improve on the Levitus WOA98 Atlas, in the Australian region. CARS2000 is derived from ocean cast data, which is always measured above the sea floor. However, for properties which do not change rapidly near the sea floor, this would not lead to a significant error. All the limitations of CARS2000 also apply here.
-
Salinity, linearly interpolated from CARS2000 mean and seasonal fields to 0.1 degree spaced grid, at depths of 0, 150, 500, 1000 and 2000 metres. The loess filter used to create CARS2000 resolves at each point a mean value and a sinusoid with 1 year period (and in some cases a 6 month period sinusoid - the "semi-annual cycle".) The provided "annual amplitude" is simply the magnitude of that annual sinusoid. CARS is a set of seasonal maps of temperature, salinity, dissolved oxygen, nitrate, phosphate and silicate, generated using Loess mapping from all available oceanographic data in the region. It covers the region 100-200E, 50-0S, on a 0.5 degree grid, and on 56 standard depth levels. Higher resolution versions are also available for the Australian continental shelf. The data was obtained from the World Ocean Atlas 98 and CSIRO Marine and NIWA archives. It was designed to improve on the Levitus WOA98 Atlas, in the Australian region.
-
These data, reported in various volumes of CSIRO's "Oceanographic Station List" series between 1957 and 1962, comprise mainly measurements of surface temperature, salinity (as chlorinity), and (in later stages) phosphate from sea surface samples collected by merchant ships in Bass Strait and surrounding waters. Vessels contributing t the sampling program include TSS "Taroona" and "Princess of Tasmania, SS "Talune", and MVs "Claire Crouch", "Denman", Century", "Jillian Crouch", "Lorinna", "Marra", "Pateena", "Poolta", "Risdon", and "Wareatea". Sampling began in December 1954 and was still in progress December 1960, the last date for which data were published in this series. The merchant vessel sampling program was carried out at a time when the CSIRO Division of Fisheries had no dedicated ocean-going research vessel, as a means of acquiring information about offshore waters. In the volumes cited, similar data are also reported from the Coral Sea, Tasman Sea, and the south-east Indian Ocean.
-
These data, reported in CSIRO's "Oceanographic Station List" series in 1957, comprise mainly measurements of surface temperature, and salinity (as chlorinity), from sea surface samples collected by the merchant ships MV "Dulverton", MV "Kabbarli" and MV "Duntroon". Sampling was only carried out in one year (1956). The merchant vessel sampling program was carried out at a time when the CSIRO Division of Fisheries had no dedicated ocean-going research vessel, as a means of acquiring information about offshore waters. In the volumes cited, similar data are also reported from the Tasman Sea, Coral Sea, and south-eastern Australian waters and Bass Strait.
-
These data, reported in various volumes of CSIRO's "Oceanographic Station List" series between 1955 and 1962, comprise mainly measurements of surface temperature, salinity (as chlorinity), and (in later stages) phosphate from sea surface samples collected by the merchant ship TSMV "Wanganella" on regular runs between Sydney and Auckland or Wellengton, New Zealand. Sampling began in December 1952 and was still in progress December 1960, the last date for which data were published in this series. The merchant vessel sampling program was carried out at a time when the CSIRO Division of Fisheries had no dedicated ocean-going research vessel, as a means of acquiring information about offshore waters. In the volumes cited, similar data are also reported from the Coral Sea, south-eastern Australian waters and Bass Strait, and the south-east Indian Ocean.
-
These data, reported in various volumes of CSIRO's "Oceanographic Station List" series between 1957 and 1962, comprise mainly measurements of surface temperature, salinity (as chlorinity), and (in later stages) phosphate from sea surface samples collected by the merchant ships MV "Tulagi" and MV "Malaita" on regular runs between Australia's east coast and New Caledonia via Norfolk Island ("Tulagi") and New Guinea ("Malaita"). Sampling began in 1955 and was still in progress December 1960, the last date for which data were published in this series. The merchant vessel sampling program was carried out at a time when the CSIRO Division of Fisheries had no dedicated ocean-going research vessel, as a means of acquiring information about offshore waters. In the volumes cited, similar data are also reported from the Tasman Sea, south-eastern Australian waters and Bass Strait, and the south-east Indian Ocean.
-
This dataset contains log sheets recorded during on Sprightly cruise SP 09/76. The cruise took place in WA coastal waters off Freemantle 9th - 11th February 1976. Log sheets include Station Locations, Cruise Diary, Hydrology Surface Sample Log Sheet, Inductive Salinometer log sheet, Meteorology Log. These documents have been scanned to PDF, and are available via the data link in this record. Additional information regarding this dataset is contained in the cruise report for this voyage.